Market Outlook
August 1, 2017
Market Cues
Domestic Indices
Chg (%)
(Pts)
(Close)
Indian markets are likely to open positive tracking global indices and SGX Nifty.
BSE Sensex
0.6
205
32,515
U.S. markets slumped Monday despite a strong performance for the month, spurred
Nifty
0.6
63
10,077
by healthy corporate results and growing optimism in the strength of the global
Mid Cap
0.4
60
15,390
economy. Treasuries slid and the dollar added to its biggest monthly retreat since
Small Cap
0.1
22
16,094
January.
Bankex
1.3
365
28,387
European markets turned in a mixed performance on Monday, as HSBC Holdings
announced a share buyback and mining stocks rallied after strong manufacturing
Global Indices
Chg (%)
(Pts)
(Close)
data from China. On the economic front, Eurozone inflation held steady at 1.3
percent in July, official data showed, helping ease pressure on policymakers to
Dow Jones
0.3
61
21,891
tighten monetary policy.
Nasdaq
(0.4)
(27)
6,348
FTSE
0.0
4
7,372
Indian markets rose notably on Monday amid hopes that the Reserve Bank of India
Nikkei
(0.2)
(35)
19,925
will cut interest rates by 25 bps when it reviews its monetary policy on August 2.
Positive cues from Asia and Europe also aided investor sentiment.
Hang Seng
1.3
345
27,324
Shanghai Com
0.6
20
3,273
Result Review
Result Review: Tech Mahindra and UPL Limited Q1FY18
Advances / Declines
BSE
NSE
Detailed analysis is on Pg2
Advances
1,284
809
Investor’s Ready Reckoner
Declines
1,453
891
Unchanged
159
84
Key Domestic & Global Indicators
Stock Watch: Latest investment recommendations on 150+ stocks
Volumes (` Cr)
Refer Pg7 onwards
BSE
3,689
Top Picks
NSE
28,676
CMP
Target
Upside
Company
Sector
Rating
(`)
(`)
(%)
Blue Star
Capital Goods
Accumulate
698
760
8.9
#Net Inflows (` Cr)
Net
Mtd
Ytd
Dewan Housing FinanceFinancials
Buy
457
550
20.4
FII
(11)
3,706
59,614
Mahindra Lifespace
Real Estate
Buy
421
522
24.0
MFs
(169)
8,129
47,275
Navkar Corporation
Others
Buy
204
265
30.0
KEI Industries
Capital Goods
Accumulate
231
258
11.6
More Top Picks on Pg5
Top Gainers
Price (`)
Chg (%)
Key Upcoming Events
Infibeam
1,415
8.6
Previous
Consensus
Date
Region
Event Description
Shreecem
18,639
6.6
Reading
Expectations
Balramchin
165
6.5
Aug 01, 2017 Germany PMI Manufacturing
58.30
58.30
Aug 01, 2017 UK
PMI Manufacturing
54.30
54.50
Torntpharm
1,317
5.6
Aug 01, 2017 Germany Unemployment change (000's)
7.00
(5.00)
Cub
177
5.6
Aug 01, 2017 Euro Zone Euro-Zone GDP s.a. (QoQ)
0.50
0.60
Aug 02, 2017 India
RBI Cash Reserve ratio
4.00
4.00
Top Losers
Price (`)
Chg (%)
More Events on Pg7
Vguard
178
(8.1)
Icil
149
(5.2)
Marksans
43
(4.5)
Advenzymes
314
(4.3)
Lichsgfin
692
(4.1)
#as on 31st July, 2017
Market Outlook
August 1, 2017
Result Review
Tech Mahindra (CMP: `385 / TP: `533 /Upside:38.3%)
Tech Mahindra for 1QFY2018 posted good set of numbers. The sales came in at
US$1,138mn V/s US$1,127mn expected and V/s US$1,131mn in 4QFY2017, a
qoq growth of 0.6%. In Rupee terms, the sales came in at `7,336cr V/s `7,262cr
expected v/s `7,495cr posted a qoq dip of 2.1%. The sales growth during the
quarter was driven by the USA, which constituted 46.8% of sales v/s 45.1% in
4QFY2017, while ROW dipped to 23.4% of sales V/s
25.3% of sales in
4QFY2017.
On operating front, the EBIT margins came in at 9.4% V/s 8.6% expected V/s 8.2%
in 4QFY2017, a qoq expansion of 117bps, mainly on back of base effect.
Consequently, the PAT came in at `798cr V/s `624cr expected V/s `588cr in
4QFY2017, a qoq growth of 35.8%. We maintain our buy rating on the stock.
Y/E
Sales OPM
PAT
EPS ROE P/E P/BV EV/EBITDA EV/Sales
March
(` cr)
(%)
(` cr)
(`)
(%)
(x)
(x)
(x)
(x)
FY2018E
31,015
15.0
3,102
35.6
17.0
10.8
1.8
7.6
1.1
FY2019E
33,496
15.0
3,315
38.1
16.3
10.1
1.7
6.9
1.0
UPL Limited (CMP: `873 / TP: /Upside :)
UPL posted good set of numbers for 1QFY2018. Sales came in at `3,723cr V/s
`3,644cr, a yoy growth of 7.8%. On operating front, the Gross profit margins
came in at 59.2% V/s 53.6% in 1QFY2017, which in part aided the OPM to come
in at 18.6% V/s 17.7% in 1QFY2017. The expansion in OPM was lower than the
expansion in gross profit margins mainly aided by a lower sales growth during the
quarter. The PBT during the quarter, posted a yoy growth of 37.2%, aided by a
52.0% yoy growth in other income (`101cr V/s `66cr in 1QFY2017). Thus, net
profit came in at `475cr V/s `361cr in 1QFY2017, a yoy growth of 31.6%. Adj.
net profit came in at `496cr V/s `392cr a yoy growth of 26.4%. We maintain our
neutral view on the stock.
Y/E
Sales OPM
PAT
EPS ROE P/E P/BV EV/EBITDA EV/Sales
March
(` cr)
(%)
(` cr)
(`)
(%)
(x)
(x)
(x)
(x)
FY2018E
18,922
17.8
1,889
37.3
23.3
23.6
9.1
13.5
2.4
FY2019E
21,949
17.8
2,272
44.8
23.3
19.7
7.6
11.3
2.0
Market Outlook
August 1, 2017
Economic and Political News
Fiscal deficit at 81% of budget estimates in Q1
More than 40 hydro projects running behind schedule, says Piyush Goyal
`20,000cr allocated for Namami Gange Programme: Uma Bharti
Corporate News
Max India pulls out of Max Life-HDFC Life deal
ITC's 64 mm budget brand cigarette sales to go up in GST regime
InterGlobe Aviation Q1 net up 37% on higher passenger revenue
Quarterly Bloomberg Brokers Consensus Estimate
JSW Steel Ltd Consol - Aug 1, 2017
Particulars ( ` cr)
1QFY18E
1QFY17
y-o-y (%)
4QFY17
q-o-q (%)
Net sales
14,200
11,542
23.0
16,287
(12.8)
EBITDA
2,414
3,269
(26.2)
3,165
(23.7)
EBITDA margin (%)
17.0
28.3
19.4
Net profit
478
1,109
(56.9)
1,014
(52.9)
Power Grid Corp of India Ltd - Aug 1, 2017
Particulars ( ` cr)
1QFY18E
1QFY17
y-o-y (%)
4QFY17
q-o-q (%)
Net sales
7,190
6,069
18.5
6,712
7.1
EBITDA
6,266
5,420
15.6
5,619
11.5
EBITDA margin (%)
87.2
89.3
83.7
Net profit
2,145
1,802
19.1
1,916
11.9
Marico Consol - Aug 1, 2017
Particulars ( ` cr)
1QFY18E
1QFY17
y-o-y (%)
4QFY17
q-o-q (%)
Net sales
1,774
1,750
1.4
1,315
34.9
EBITDA
368
374
(1.6)
259
41.8
EBITDA margin (%)
20.7
21.4
19.7
Net profit
260
264
(1.5)
171
52.0
Piramal Enterprises Ltd - Aug 1, 2017
Particulars ( ` cr)
1QFY18E
1QFY17
y-o-y (%)
4QFY17
q-o-q (%)
Net sales
2635
1,776
48.4
2450
7.6
Net profit
339
231
46.8
310
9.4
Market Outlook
August 1, 2017
Top Picks HHHHH
Market Cap
CMP
Target
Upside
Company
Rationale
(` Cr)
(`)
(`)
(%)
Strong growth in domestic business due to its leadership
in acute therapeutic segment. Alkem expects to launch
Alkem Laboratories
21,767
1,821
2,161
18.7
more products in USA, which bodes for its international
business.
We expect the company would report strong profitability
Asian Granito
1,252
416
480
15.4
owing to better product mix, higher B2C sales and
amalgamation synergy.
Favourable outlook for the AC industry to augur well for
Cooling products business which is out pacing the
Blue Star
6,681
698
760
8.9
market growth. EMPPAC division's profitability to improve
once operating environment turns around.
With a focus on the low and medium income (LMI)
consumer segment, the company has increased its
Dewan Housing Finance
14,321
457
550
20.4
presence in tier-II & III cities where the growth
opportunity is immense.
Loan growth is likely to pick up after a sluggish FY17.
Karur Vysya Bank
8,448
140
160
14.4
Lower credit cost will help in strong bottomline growth.
Increasing share of CASA will help in NIM improvement.
High order book execution in EPC segment, rising B2C
KEI Industries
1,799
231
258
11.6
sales and higher exports to boost the revenues and
profitability
Speedier execution and speedier sales, strong revenue
Mahindra Lifespace
2,160
421
522
24.0
visibilty in short-to-long run, attractive valuations
Massive capacity expansion along with rail advantage at
Navkar Corporation
2,906
204
265
30.0
ICD as well CFS augurs well for the company
Strong brands and distribution network would boost
Siyaram Silk Mills
1,959
2,090
2,500
19.6
growth going ahead. Stock currently trades at an
inexpensive valuation.
Market leadership in Hindi news genre and no.
2
viewership ranking in English news genre, exit from the
TV Today Network
1,444
242
344
42.1
radio business, and anticipated growth in ad spends by
corporates to benefit the stock.
After GST, the company is expected to see higher
volumes along with improving product mix. The Gujarat
Maruti
2,32,842
7,708
8,495
10.2
plant will also enable higher operating leverage which
will be margin accretive.
Source: Company, Angel Research,
Market Outlook
August 01, 2017
Key Upcoming Events
Result Calendar
Date
Company
Marico, JSW Steel , Power Grid Corpn
August 01, 2017
KEC International, Punjab Natl.Bank, UCO Bank, Lupin, Reliance Infra., Transport Corporation of India,
August 02, 2017
Narayana Hrudaya
CEAT, Cummins India, J K Lakshmi Cements, Electrosteel Castings, IOC, Bajaj Electrical, Elecon
August 03, 2017
Engineering
Source: Bloomberg, Angel Research
Global economic events release calendar
Bloomberg Data
Date
Time
Country
Event Description
Unit
Period
Last Reported
Estimated
Aug 01, 2017
1:25 PMGermany PMI Manufacturing
Value
Jul F
58.30
58.30
2:00 PMUK
PMI Manufacturing
Value
Jul
54.30
54.50
1:25 PMGermany Unemployment change (000's)
Thousands
Jul
7.00
(5.00)
2:30 PMEuro Zone Euro-Zone GDP s.a. (QoQ)
% Change
2Q A
0.50
0.60
Aug 02, 2017
2:30 PMIndia
RBI Cash Reserve ratio
%
Aug 2
4.00
4.00
2:30 PMIndia
RBI Reverse Repo rate
%
Aug 2
6.00
5.75
2:30 PMIndia
RBI Repo rate
%
Aug 2
6.25
6.00
Aug 03, 2017
6:00 PMUS
Initial Jobless claims
Thousands
Jul 29
244.00
242.00
1:25 PMGermany PMI Services
Value
Jul F
53.50
53.50
4:30 PMUK
BOE Announces rates
% Ratio
Aug 3
0.25
0.25
Aug 04, 2017
6:00 PMUS
Change in Nonfarm payrolls
Thousands
Jul
222.00
180.00
6:00 PMUS
Unnemployment rate
%
Jul
4.40
4.30
Aug 08, 2017
China
Exports YoY%
% Change
Jul
11.30
10.50
Aug 09, 2017
7:00 AMChina
Consumer Price Index (YoY)
% Change
Jul
1.50
1.40
Aug 10, 2017
India
Imports YoY%
% Change
Jul
19.00
Source: Bloomberg, Angel Research
Market Outlook
August 01, 2017
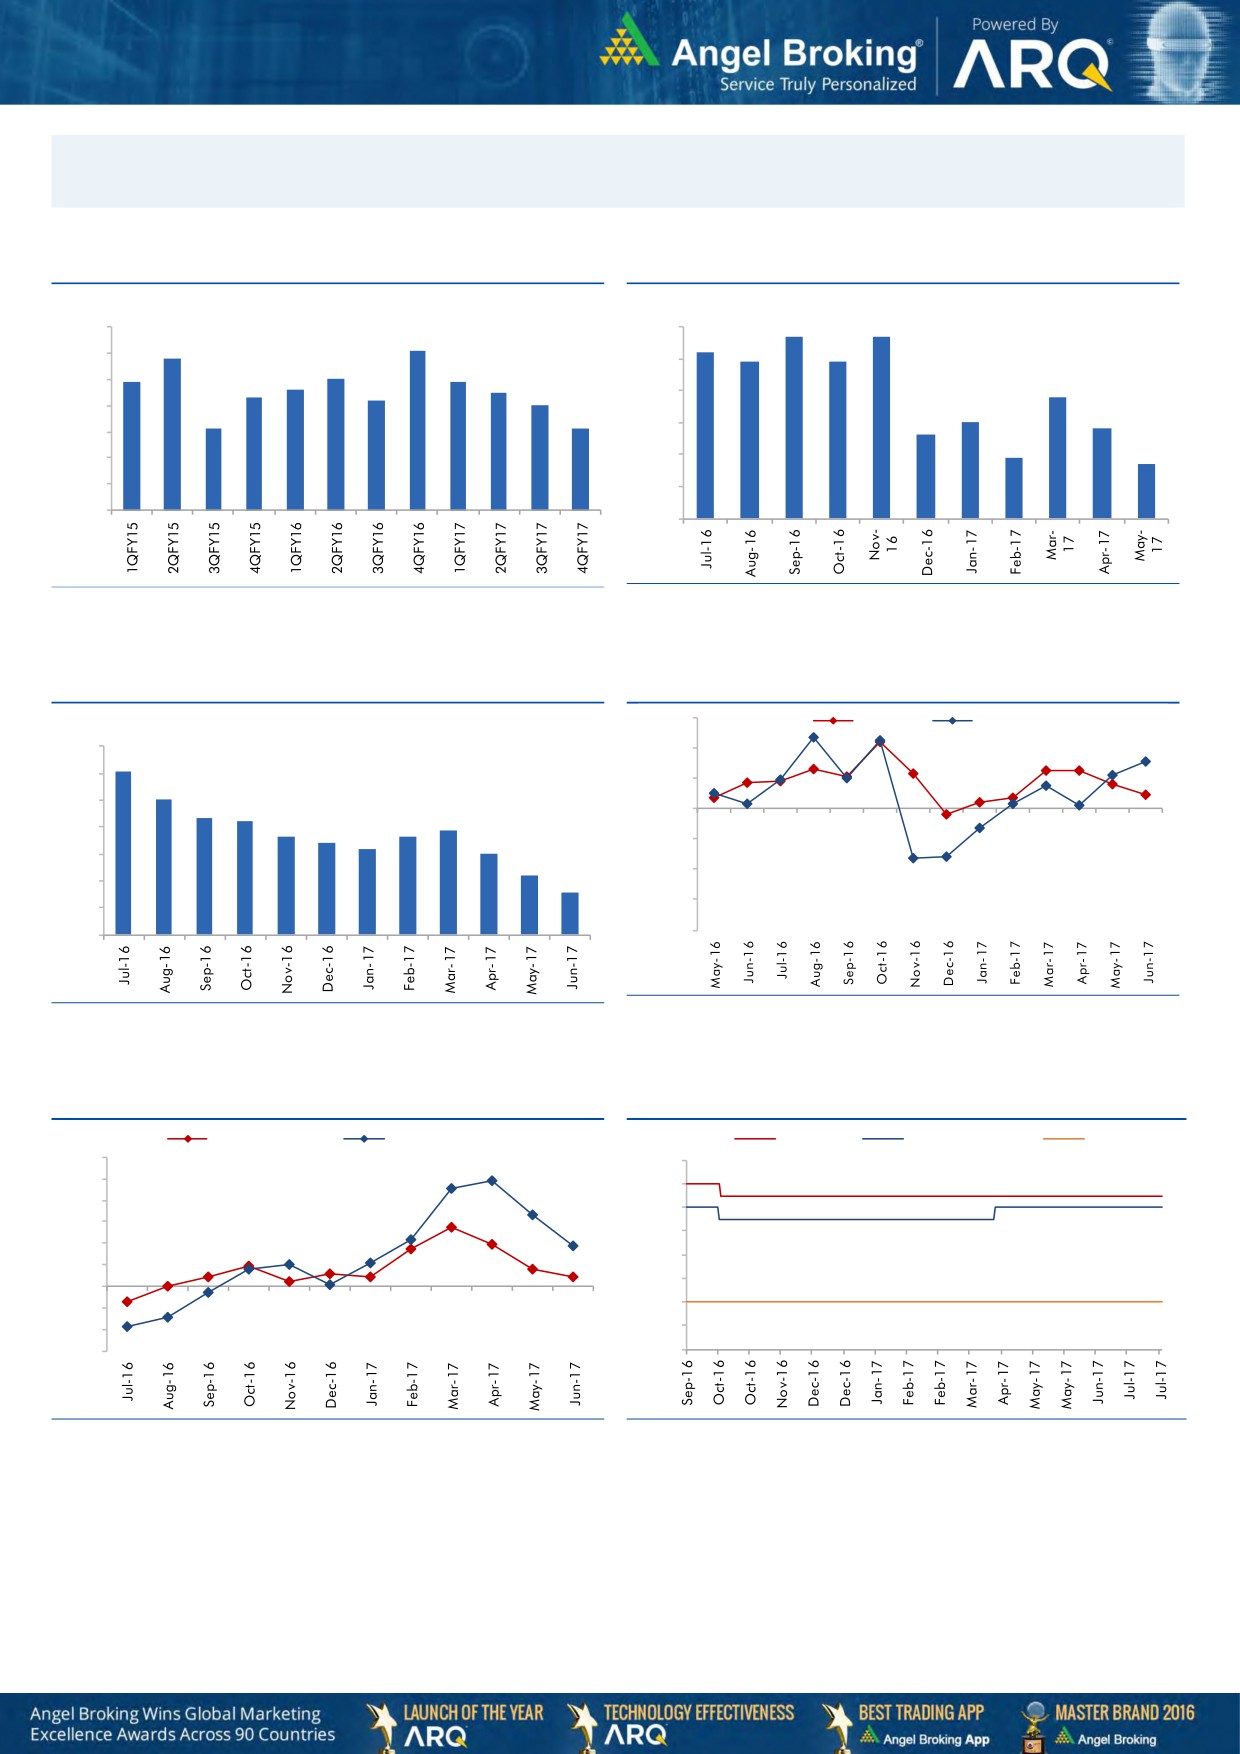
Macro watch
Exhibit 1: Quarterly GDP trends
Exhibit 2: IIP trends
(%)
(%)
5.7
5.7
10.0
6.0
9.1
5.2
8.8
4.9
4.9
9.0
7.9
8.0
7.9
5.0
7.6
7.5
8.0
7.3
7.2
3.8
7.0
4.0
7.0
3.0
6.1
6.1
2.8
3.0
2.6
6.0
1.9
1.7
5.0
2.0
4.0
1.0
3.0
-
Source: CSO, Angel Research
Source: MOSPI, Angel Research
Exhibit 3: Monthly CPI inflation trends
Exhibit 4: Manufacturing and services PMI
56.0
Mfg. PMI
Services PMI
(%)
7.0
54.0
6.1
6.0
52.0
5.1
5.0
4.3
4.2
3.9
50.0
3.6
3.7
4.0
3.4
3.2
3.0
48.0
3.0
2.2
46.0
2.0
1.5
44.0
1.0
-
42.0
Source: Market, Angel Research; Note: Level above 50 indicates expansion
Source: MOSPI, Angel Research
Exhibit 5: Exports and imports growth trends
Exhibit 6: Key policy rates
(%)
Exports yoy growth
Imports yoy growth
(%)
Repo rate
Reverse Repo rate
CRR
60.0
7.00
50.0
6.50
40.0
6.00
30.0
5.50
20.0
5.00
10.0
4.50
0.0
4.00
(10.0)
(20.0)
3.50
(30.0)
3.00
Source: Bloomberg, Angel Research
Source: RBI, Angel Research
Market Outlook
August 01, 2017
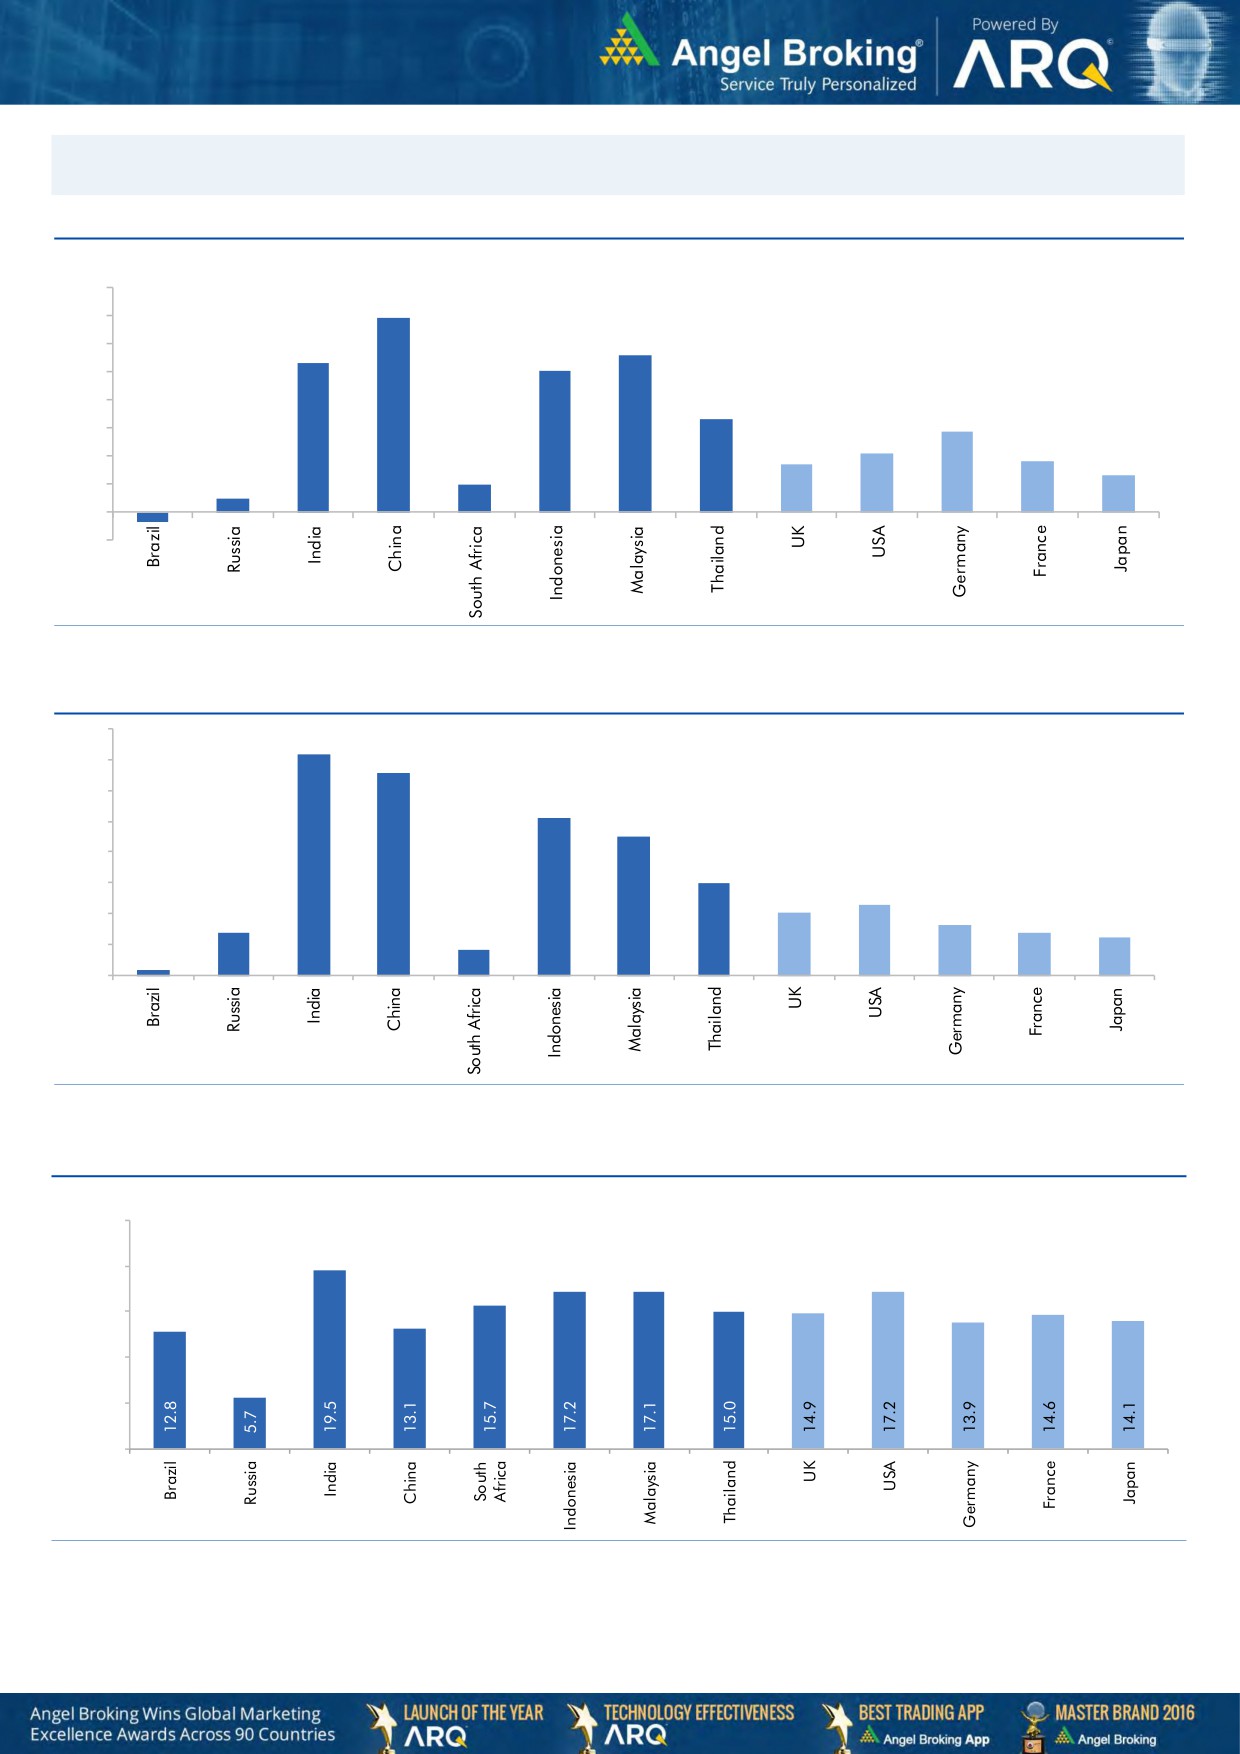
Global watch
Exhibit 1: Latest quarterly GDP Growth (%, yoy) across select developing and developed countries
(%)
8.0
6.9
7.0
5.6
6.0
5.3
5.0
1.0
5.0
4.0
3.3
2.9
3.0
2.1
1.7
1.8
0.5
2.0
1.3
1.0
-
(1.0)
(0.4)
Source: Bloomberg, Angel Research
Exhibit 2: 2016 GDP Growth projection by IMF (%, yoy) across select developing and developed countries
(%)
7.2
7.0
6.6
6.0
5.1
5.0
4.5
4.0
3.0
3.0
2.3
2.0
1.4
1.6
2.0
1.4
1.2
0.2
0.8
1.0
-
Source: IMF, Angel Research
Exhibit 3: One year forward P-E ratio across select developing and developed countries
(x)
25.0
20.0
15.0
10.0
5.0
-
Source: IMF, Angel Research
Stock Watch
August 01, 2017
Company Name
Reco
CMP
Target
Mkt Cap
Sales ( Čcr )
OPM(%)
EPS (Č)
PER(x)
P/BV(x)
RoE(%)
EV/Sales(x)
(Č)
Price ( Č)
( Č cr )
FY17E FY18E
FY17E
FY18E
FY17E
FY18E
FY17E
FY18E
FY17E
FY18E
FY17E
FY18E
FY17E
FY18E
Agri / Agri Chemical
Rallis
Reduce
240
209
4,673
1,937
2,164
13.3
14.3
9.0
11.0
26.7
21.9
4.7
4.1
18.4
19.8
2.5
2.2
United Phosphorus
Neutral
876
-
44,476
15,176
17,604
18.5
18.5
37.4
44.6
23.4
19.6
4.6
3.8
21.4
21.2
3.0
2.6
Auto & Auto Ancillary
Ashok Leyland
Accumulate
110
116
32,089
20,019
22,789
11.1
11.7
4.3
5.5
25.5
20.0
5.0
4.4
19.4
22.0
1.5
1.3
Bajaj Auto
Neutral
2,808
-
81,243
25,093
27,891
19.5
19.2
143.9
162.5
19.5
17.3
5.5
4.7
30.3
29.4
3.0
2.6
Bharat Forge
Neutral
1,147
-
26,705
7,726
8,713
20.5
21.2
35.3
42.7
32.5
26.9
6.0
5.4
18.9
20.1
3.5
3.1
Eicher Motors
Neutral
30,081
-
81,887
16,583
20,447
17.5
18.0
598.0
745.2
50.3
40.4
17.2
13.1
41.2
38.3
4.8
3.8
Gabriel India
Neutral
160
-
2,294
1,544
1,715
9.0
9.3
5.4
6.3
29.6
25.4
5.6
4.9
18.9
19.5
1.4
1.3
Hero Motocorp
Accumulate
3,654
3,854
72,971
28,120
30,753
15.2
15.6
169.1
189.2
21.6
19.3
7.4
6.2
30.8
28.2
2.4
2.2
Jamna Auto Industries Neutral
257
-
2,048
1,486
1,620
9.8
9.9
15.0
17.2
17.1
14.9
3.8
3.2
21.8
21.3
1.4
1.3
L G Balakrishnan & Bros Neutral
752
-
1,180
1,302
1,432
11.6
11.9
43.7
53.0
17.2
14.2
2.4
2.2
13.8
14.2
1.0
0.9
Mahindra and Mahindra Neutral
1,402
-
87,077
46,534
53,077
11.6
11.7
67.3
78.1
20.8
18.0
3.4
3.0
15.4
15.8
1.8
1.6
Maruti
Accumulate
7,708
8,495
232,842
67,822
83,717
15.2
15.0
243.0
291.5
31.7
26.4
7.3
5.9
22.9
22.4
3.1
2.4
Minda Industries
Neutral
792
-
6,840
2,728
3,042
9.0
9.1
68.2
86.2
11.6
9.2
2.6
2.1
23.8
24.3
2.6
2.3
Motherson Sumi
Neutral
325
-
68,418
45,896
53,687
7.8
8.3
13.0
16.1
24.9
20.2
8.0
6.4
34.7
35.4
1.6
1.3
Rane Brake Lining
Neutral
1,305
-
1,033
511
562
11.3
11.5
28.1
30.9
46.4
42.2
7.1
6.4
15.3
15.0
2.2
2.0
Setco Automotive
Neutral
40
-
528
741
837
13.0
13.0
15.2
17.0
2.6
2.3
0.4
0.4
15.8
16.3
1.1
1.0
Tata Motors
Neutral
445
-
128,343
300,209
338,549
8.9
8.4
42.7
54.3
10.4
8.2
1.7
1.4
15.6
17.2
0.5
0.5
TVS Motor
Neutral
582
-
27,657
13,390
15,948
6.9
7.1
12.8
16.5
45.6
35.2
11.4
9.0
26.3
27.2
2.1
1.7
Amara Raja Batteries
Buy
835
962
14,254
5,339
6,220
15.9
15.3
28.0
32.3
29.8
25.8
5.7
4.8
19.1
18.5
2.7
2.3
Exide Industries
Neutral
217
-
18,458
7,439
8,307
15.0
15.0
8.1
9.3
26.8
23.4
3.8
3.4
14.3
16.7
2.1
1.9
Apollo Tyres
Neutral
267
-
13,568
12,877
14,504
14.3
13.9
21.4
23.0
12.4
11.6
1.9
1.7
16.4
15.2
1.2
1.1
Ceat
Neutral
1,875
-
7,584
7,524
8,624
13.0
12.7
131.1
144.3
14.3
13.0
2.6
2.2
19.8
18.6
1.1
0.9
JK Tyres
Neutral
162
-
3,665
7,455
8,056
15.0
15.0
21.8
24.5
7.4
6.6
1.6
1.3
22.8
21.3
0.6
0.5
Swaraj Engines
Neutral
2,100
-
2,608
660
810
15.2
16.4
54.5
72.8
38.5
28.9
12.0
10.9
31.5
39.2
3.8
3.1
Subros
Neutral
237
-
1,423
1,488
1,681
11.7
11.9
6.4
7.2
37.1
33.1
3.9
3.6
10.8
11.4
1.2
1.0
Indag Rubber
Neutral
199
-
522
286
326
19.8
16.8
11.7
13.3
17.0
14.9
2.9
2.7
17.8
17.1
1.5
1.3
Capital Goods
ACE
Neutral
70
-
691
709
814
4.1
4.6
1.4
2.1
49.9
33.3
2.1
1.9
4.4
6.0
1.1
1.0
BEML
Neutral
1,727
-
7,192
3,451
4,055
6.3
9.2
31.4
57.9
55.0
29.8
3.3
3.0
6.3
10.9
2.2
1.9
Bharat Electronics
Neutral
179
-
39,926
8,137
9,169
16.8
17.2
58.7
62.5
3.1
2.9
0.5
0.4
44.6
46.3
3.9
3.5
Stock Watch
August 01, 2017
Company Name
Reco
CMP
Target
Mkt Cap
Sales ( Čcr )
OPM(%)
EPS (Č)
PER(x)
P/BV(x)
RoE(%)
EV/Sales(x)
(Č)
Price ( Č)
( Č cr )
FY17E
FY18E
FY17E
FY18E
FY17E
FY18E
FY17E
FY18E
FY17E
FY18E
FY17E
FY18E
FY17E
FY18E
Capital Goods
Voltas
Neutral
504
-
16,668
6,511
7,514
7.9
8.7
12.9
16.3
39.1
30.9
7.0
6.2
16.7
18.5
2.3
2.0
BGR Energy
Neutral
150
-
1,082
16,567
33,848
6.0
5.6
7.8
5.9
19.2
25.4
1.1
1.1
4.7
4.2
0.2
0.1
BHEL
Neutral
145
-
35,441
28,797
34,742
-
2.8
2.3
6.9
63.0
21.0
1.1
1.0
1.3
4.8
0.9
0.6
Blue Star
Accumulate
698
760
6,681
4,283
5,077
5.9
7.3
14.9
22.1
46.9
31.5
9.1
7.7
20.4
26.4
1.6
1.4
CG Power and Industrial
Neutral
85
-
5,318
5,777
6,120
5.9
7.0
3.3
4.5
25.7
18.9
1.1
1.1
4.4
5.9
0.9
0.8
Solutions
Greaves Cotton
Neutral
161
-
3,937
1,755
1,881
16.8
16.9
7.8
8.5
20.7
19.0
4.1
3.8
20.6
20.9
1.9
1.8
Inox Wind
Neutral
138
-
3,052
5,605
6,267
15.7
16.4
24.8
30.0
5.6
4.6
1.6
1.1
25.9
24.4
0.6
0.5
KEC International
Neutral
304
-
7,817
9,294
10,186
7.9
8.1
9.9
11.9
30.7
25.6
4.5
3.9
15.6
16.3
1.1
1.0
KEI Industries
Accumulate
231
258
1,799
2,633
3,001
10.4
10.0
12.7
13.0
18.2
17.8
3.9
3.2
21.4
18.2
0.9
0.8
Thermax
Neutral
873
-
10,398
5,421
5,940
7.3
7.3
25.7
30.2
34.0
28.9
4.1
3.8
12.2
13.1
1.8
1.7
VATech Wabag
Accumulate
610
681
3,331
3,136
3,845
8.9
9.1
26.0
35.9
23.5
17.0
2.9
2.5
13.4
15.9
1.0
0.8
Cement
ACC
Neutral
1,733
-
32,546
11,225
13,172
13.2
16.9
44.5
75.5
39.0
23.0
3.7
3.4
11.2
14.2
2.9
2.5
Ambuja Cements
Neutral
263
-
52,272
9,350
10,979
18.2
22.5
5.8
9.5
45.4
27.7
3.8
3.4
10.2
12.5
5.6
4.8
India Cements
Neutral
203
-
6,268
4,364
4,997
18.5
19.2
7.9
11.3
25.8
18.0
1.9
1.8
8.0
8.5
2.2
1.9
JK Cement
Neutral
1,019
-
7,123
4,398
5,173
15.5
17.5
31.2
55.5
32.7
18.4
3.9
3.4
12.0
15.5
2.2
1.8
J K Lakshmi Cement
Neutral
458
-
5,395
2,913
3,412
14.5
19.5
7.5
22.5
61.1
20.4
3.8
3.2
12.5
18.0
2.4
2.0
Orient Cement
Neutral
156
-
3,194
2,114
2,558
18.5
20.5
8.1
11.3
19.3
13.8
2.8
2.4
9.0
14.0
2.1
1.7
UltraTech Cement
Neutral
4,060
-
111,455
25,768
30,385
21.0
23.5
111.0
160.0
36.6
25.4
4.7
4.1
13.5
15.8
4.4
3.7
Construction
ITNL
Neutral
92
-
3,033
8,946
10,017
31.0
31.6
8.1
9.1
11.4
10.1
0.4
0.4
4.2
5.0
3.7
3.4
KNR Constructions
Neutral
211
-
2,971
1,385
1,673
14.7
14.0
41.2
48.5
5.1
4.4
1.0
0.8
14.9
15.2
2.2
1.8
Larsen & Toubro
Buy
1,192
1,700
166,929
111,017
124,908
11.0
11.0
61.1
66.7
19.5
17.9
2.3
2.2
13.1
12.9
2.5
2.3
Gujarat Pipavav Port
Neutral
147
-
7,099
705
788
52.2
51.7
5.0
5.6
29.4
26.2
2.9
2.6
11.2
11.2
9.7
8.2
Nagarjuna Const.
Neutral
89
-
4,939
8,842
9,775
9.1
8.8
5.3
6.4
16.8
13.9
1.3
1.2
8.2
9.1
0.7
0.6
PNC Infratech
Neutral
142
-
3,643
2,350
2,904
13.1
13.2
9.0
8.8
15.8
16.1
0.6
0.5
15.9
13.9
1.7
1.4
Simplex Infra
Neutral
483
-
2,389
6,829
7,954
10.5
10.5
31.4
37.4
15.4
12.9
1.6
1.5
9.9
13.4
0.8
0.7
Power Mech Projects
Neutral
585
-
861
1,801
2,219
12.7
14.6
72.1
113.9
8.1
5.1
1.5
1.3
16.8
11.9
0.5
0.4
Sadbhav Engineering
Neutral
293
-
5,034
3,598
4,140
10.3
10.6
9.0
11.9
32.6
24.7
3.4
3.0
9.9
11.9
1.7
1.4
NBCC
Neutral
210
-
18,855
7,428
9,549
7.9
8.6
8.2
11.0
25.6
19.1
1.3
1.0
28.2
28.7
2.3
1.7
MEP Infra
Neutral
118
-
1,922
1,877
1,943
30.6
29.8
3.0
4.2
39.4
28.2
19.1
12.9
0.6
0.6
2.4
2.2
Stock Watch
August 01, 2017
Company Name
Reco
CMP
Target
Mkt Cap
Sales ( Čcr )
OPM(%)
EPS (Č)
PER(x)
P/BV(x)
RoE(%)
EV/Sales(x)
(Č)
Price ( Č)
( Č cr )
FY17E
FY18E
FY17E
FY18E
FY17E
FY18E
FY17E
FY18E
FY17E
FY18E
FY17E
FY18E
FY17E
FY18E
Construction
SIPL
Neutral
105
-
3,711
1,036
1,252
65.5
66.2
(8.4)
(5.6)
4.0
4.5
(22.8)
(15.9)
11.8
9.8
Engineers India
Neutral
159
-
10,704
1,725
1,935
16.0
19.1
11.4
13.9
13.9
11.4
1.9
1.9
13.4
15.3
5.1
4.6
Financials
Axis Bank
Accumulate
519
580
124,378
46,932
53,575
3.5
3.4
32.4
44.6
16.0
11.6
2.1
1.8
13.6
16.5
-
-
Bank of Baroda
Neutral
166
-
38,157
19,980
23,178
1.8
1.8
11.5
17.3
14.4
9.6
1.7
1.4
8.3
10.1
-
-
Canara Bank
Neutral
368
-
21,986
15,225
16,836
1.8
1.8
14.5
28.0
25.4
13.2
1.8
1.4
5.8
8.5
-
-
Can Fin Homes
Neutral
3,089
-
8,223
420
526
3.5
3.5
86.5
107.8
35.7
28.7
7.7
6.3
23.6
24.1
-
-
Cholamandalam Inv. &
Neutral
1,198
-
18,727
2,012
2,317
6.3
6.3
42.7
53.6
28.1
22.4
4.4
3.8
16.9
18.3
-
-
Fin. Co.
Dewan Housing Finance Buy
457
550
14,321
2,225
2,688
2.9
2.9
29.7
34.6
15.4
13.2
2.5
1.6
16.1
14.8
-
-
Equitas Holdings
Buy
167
235
5,655
939
1,281
11.7
11.5
5.8
8.2
28.8
20.4
2.5
2.2
10.9
11.5
-
-
Federal Bank
Accumulate
115
125
22,393
8,259
8,995
3.0
3.0
4.3
5.6
26.8
20.6
2.3
2.1
8.5
10.1
-
-
HDFC
Neutral
1,786
-
284,515
11,475
13,450
3.4
3.4
45.3
52.5
39.4
34.0
7.6
6.7
20.2
20.5
-
-
HDFC Bank
Neutral
1,783
-
459,238
46,097
55,433
4.5
4.5
58.4
68.0
30.5
26.2
5.4
4.5
18.8
18.6
-
-
ICICI Bank
Accumulate
302
335
193,653
42,800
44,686
3.1
3.3
18.0
21.9
16.8
13.8
2.3
2.1
11.1
12.3
-
-
Karur Vysya Bank
Accumulate
140
160
8,448
5,640
6,030
3.3
3.2
8.9
10.0
15.7
14.0
1.7
1.5
11.2
11.4
-
-
Lakshmi Vilas Bank
Neutral
178
-
3,423
3,339
3,799
2.7
2.8
11.0
14.0
16.2
12.8
1.7
1.5
11.2
12.7
-
-
LIC Housing Finance
Neutral
692
-
34,897
3,712
4,293
2.6
2.5
39.0
46.0
17.7
15.0
3.3
2.8
19.9
20.1
-
-
Punjab Natl.Bank
Neutral
162
-
34,516
23,532
23,595
2.3
2.4
6.8
12.6
23.9
12.9
3.7
2.6
3.3
6.5
-
-
RBL Bank
Neutral
535
-
20,283
1,783
2,309
2.6
2.6
12.7
16.4
42.1
32.6
4.6
4.1
12.8
13.3
-
-
Repco Home Finance
Accumulate
745
825
4,661
388
457
4.5
4.2
30.0
38.0
24.8
19.6
4.1
3.5
18.0
19.2
-
-
South Ind.Bank
Neutral
30
-
5,446
6,435
7,578
2.5
2.5
2.7
3.1
11.2
9.7
1.4
1.2
10.1
11.2
-
-
St Bk of India
Neutral
313
-
269,795
88,650
98,335
2.6
2.6
13.5
18.8
23.2
16.6
2.2
1.9
7.0
8.5
-
-
Union Bank
Neutral
158
-
10,855
13,450
14,925
2.3
2.3
25.5
34.5
6.2
4.6
0.9
0.8
7.5
10.2
-
-
Yes Bank
Neutral
1,810
-
82,797
8,978
11,281
3.3
3.4
74.0
90.0
24.5
20.1
4.6
3.9
17.0
17.2
-
-
FMCG
Akzo Nobel India
Neutral
1,786
-
8,566
2,955
3,309
13.3
13.7
57.2
69.3
31.3
25.8
10.2
8.6
32.7
33.3
2.7
2.4
Asian Paints
Neutral
1,159
-
111,214
17,128
18,978
16.8
16.4
19.1
20.7
60.7
56.0
21.1
19.9
34.8
35.5
6.4
5.8
Britannia
Neutral
3,922
-
47,085
9,594
11,011
14.6
14.9
80.3
94.0
48.8
41.7
20.1
15.5
41.2
-
4.8
4.1
Colgate
Neutral
1,079
-
29,347
4,605
5,149
23.4
23.4
23.8
26.9
45.3
40.1
25.1
19.6
64.8
66.8
6.3
5.6
Dabur India
Neutral
310
-
54,625
8,315
9,405
19.8
20.7
8.1
9.2
38.3
33.7
10.7
8.8
31.6
31.0
6.2
5.5
GlaxoSmith Con*
Neutral
5,452
-
22,930
4,350
4,823
21.2
21.4
179.2
196.5
30.4
27.8
8.1
6.8
27.1
26.8
4.7
4.1
Stock Watch
August 01, 2017
Company Name
Reco
CMP
Target
Mkt Cap
Sales ( Čcr )
OPM(%)
EPS (Č)
PER(x)
P/BV(x)
RoE(%)
EV/Sales(x)
(Č)
Price ( Č)
( Č cr )
FY17E FY18E
FY17E
FY18E
FY17E
FY18E
FY17E
FY18E
FY17E
FY18E
FY17E
FY18E
FY17E
FY18E
FMCG
Godrej Consumer
Neutral
1,035
-
70,487
10,235
11,428
18.4
18.6
41.1
44.2
25.2
23.4
5.6
4.7
24.9
24.8
7.0
6.2
HUL
Neutral
1,153
-
249,638
35,252
38,495
17.8
17.8
20.7
22.4
55.9
51.5
53.4
45.8
95.6
88.9
6.9
6.3
ITC
Neutral
285
-
346,794
40,059
44,439
38.3
39.2
9.0
10.1
31.8
28.1
8.9
7.7
27.8
27.5
8.2
7.3
Marico
Neutral
334
-
43,044
6,430
7,349
18.8
19.5
6.4
7.7
52.1
43.3
15.7
13.2
33.2
32.5
6.5
5.6
Nestle*
Neutral
6,750
-
65,083
10,073
11,807
20.7
21.5
124.8
154.2
54.1
43.8
22.2
20.0
34.8
36.7
6.3
5.3
Tata Global
Neutral
170
-
10,701
8,675
9,088
9.8
9.8
7.4
8.2
22.9
20.7
1.8
1.7
7.9
8.1
1.2
1.1
Procter & Gamble
Neutral
8,042
-
26,105
2,939
3,342
23.2
23.0
146.2
163.7
55.0
49.1
13.9
11.6
25.3
23.5
8.4
7.3
Hygiene
IT
HCL Tech^
Accumulate
889
1,014
126,831
46,723
52,342
22.1
20.9
60.0
62.8
14.8
14.2
3.8
3.2
25.3
22.4
2.4
2.1
Infosys
Buy
1,011
1,179
232,290
68,484
73,963
26.0
26.0
63.0
64.0
16.1
15.8
3.4
3.1
20.8
19.7
3.1
2.7
TCS
Accumulate
2,494
2,651
491,435
117,966
127,403
27.5
27.6
134.3
144.5
18.6
17.3
5.5
5.1
29.8
29.7
3.8
3.6
Tech Mahindra
Buy
385
533
37,589
29,141
31,051
14.4
15.0
32.3
35.6
11.9
10.8
2.0
1.8
17.1
17.0
1.1
1.0
Wipro
Neutral
289
-
140,639
55,421
58,536
20.3
20.3
35.1
36.5
8.2
7.9
1.4
1.2
19.2
14.6
2.0
1.7
Media
D B Corp
Neutral
374
-
6,873
2,297
2,590
27.4
28.2
21.0
23.4
17.8
16.0
4.2
3.6
23.7
23.1
2.8
2.4
HT Media
Neutral
92
-
2,146
2,693
2,991
12.6
12.9
7.9
9.0
11.7
10.2
1.0
0.9
7.8
8.3
0.4
0.2
Jagran Prakashan
Buy
177
225
5,770
2,283
2,555
28.0
28.0
10.6
12.3
16.6
14.4
3.6
3.1
21.4
21.4
2.5
2.2
Sun TV Network
Neutral
783
-
30,875
2,850
3,265
70.1
71.0
26.2
30.4
29.9
25.8
7.7
6.8
24.3
25.6
10.4
9.0
Hindustan Media
Neutral
276
-
2,029
1,016
1,138
24.3
25.2
27.3
30.1
10.1
9.2
1.9
1.7
16.2
15.8
1.3
1.1
Ventures
TV Today Network
Buy
242
344
1,444
608
667
21.5
22.3
15.7
19.2
15.4
12.6
2.4
2.0
16.1
16.0
2.0
1.7
Music Broadcast Limited Buy
361
434
2,059
271
317
91.0
109.0
6.0
10.0
60.2
36.1
3.8
3.4
6.5
9.3
7.2
5.9
Metals & Mining
Coal India
Neutral
249
-
154,658
84,638
94,297
21.4
22.3
24.5
27.1
10.2
9.2
4.2
4.0
42.6
46.0
1.3
1.2
Hind. Zinc
Neutral
282
-
119,112
14,252
18,465
55.9
48.3
15.8
21.5
17.8
13.1
2.9
2.5
17.0
20.7
8.4
6.5
Hindalco
Neutral
219
-
49,233
107,899
112,095
7.4
8.2
9.2
13.0
23.9
16.9
1.2
1.1
4.8
6.6
1.0
0.9
JSW Steel
Neutral
221
-
53,517
53,201
58,779
16.1
16.2
130.6
153.7
1.7
1.4
0.2
0.2
14.0
14.4
1.8
1.5
NMDC
Neutral
127
-
40,102
6,643
7,284
44.4
47.7
7.1
7.7
17.9
16.5
1.6
1.5
8.8
9.2
3.8
3.4
SAIL
Neutral
63
-
26,123
47,528
53,738
(0.7)
2.1
(1.9)
2.6
24.3
0.7
0.7
(1.6)
3.9
1.4
1.3
Vedanta
Neutral
280
-
104,026
71,744
81,944
19.2
21.7
13.4
20.1
20.9
13.9
1.8
1.6
8.4
11.3
1.8
1.5
Tata Steel
Neutral
568
-
55,121
121,374
121,856
7.2
8.4
18.6
34.3
30.5
16.6
1.9
1.7
6.1
10.1
1.1
1.1
Oil & Gas
GAIL
Neutral
377
-
63,711
56,220
65,198
9.3
10.1
27.1
33.3
13.9
11.3
1.3
1.2
9.3
10.7
1.3
1.1
ONGC
Neutral
169
-
217,331
137,222
152,563
15.0
21.8
19.5
24.1
8.7
7.0
0.7
0.7
8.5
10.1
1.9
1.7
Stock Watch
August 01, 2017
Company Name
Reco
CMP
Target
Mkt Cap
Sales ( Čcr )
OPM(%)
EPS (Č)
PER(x)
P/BV(x)
RoE(%)
EV/Sales(x)
(Č)
Price ( Č)
( Č cr )
FY17E FY18E
FY17E
FY18E
FY17E
FY18E
FY17E
FY18E
FY17E
FY18E
FY17E
FY18E
FY17E
FY18E
Oil & Gas
Indian Oil Corp
Neutral
368
-
178,527
373,359
428,656
5.9
5.5
54.0
59.3
6.8
6.2
1.1
1.0
16.0
15.6
0.6
0.5
Reliance Industries
Neutral
1,614
-
524,781
301,963
358,039
12.1
12.6
87.7
101.7
18.4
15.9
1.9
1.7
10.7
11.3
2.2
1.8
Pharmaceuticals
Alembic Pharma
Buy
529
648
9,980
3,101
3,966
19.7
20.5
21.4
25.5
24.7
20.8
5.3
4.3
23.0
22.8
3.2
2.3
Alkem Laboratories Ltd
Buy
1,821
2,161
21,767
5,853
6,901
17.1
18.4
74.6
85.0
24.4
21.4
5.2
4.3
21.1
20.2
3.7
3.1
Aurobindo Pharma
Accumulate
719
823
42,148
14,845
17,086
21.5
22.1
39.4
44.7
18.3
16.1
4.5
3.6
27.6
24.7
3.0
2.6
Aventis*
Neutral
4,290
-
9,880
2,206
2,508
16.6
16.8
128.9
139.9
33.3
30.7
5.7
4.5
21.6
23.5
4.2
3.6
Cadila Healthcare
Sell
543
450
55,579
9,220
11,584
18.4
20.3
14.5
18.7
37.4
29.0
8.0
6.5
23.5
24.6
6.4
4.9
Cipla
Sell
559
461
44,953
14,281
16,619
15.4
16.2
12.5
19.7
44.7
28.4
3.6
3.2
8.4
12.0
3.3
2.8
Dr Reddy's
Neutral
2,386
-
39,541
14,081
15,937
16.1
18.6
72.6
105.9
32.9
22.5
3.2
2.9
9.6
13.6
3.0
2.7
Dishman Pharma
Sell
143
1,718
1,890
22.7
22.8
9.5
11.3
10.1
10.9
3.3
2.9
GSK Pharma*
Neutral
2,396
-
20,295
2,927
3,290
11.8
16.2
34.4
49.6
69.7
48.3
10.1
10.5
13.9
21.3
6.7
6.1
Indoco Remedies
Sell
199
153
1,837
1,067
1,154
12.1
14.9
8.4
11.3
23.7
17.6
2.8
2.5
12.6
15.0
1.9
1.8
Ipca labs
Buy
479
620
6,044
3,211
3,593
13.9
14.5
15.4
19.4
31.1
24.7
2.5
2.3
8.2
9.5
2.0
1.7
Lupin
Buy
1,032
1,526
46,620
17,120
18,657
24.1
24.1
56.9
61.1
18.1
16.9
3.4
2.9
20.7
18.6
3.0
2.4
Natco Pharma
Accumulate
974
1,060
16,970
2,065
1,988
33.1
33.7
27.9
25.7
34.9
37.9
10.2
8.7
29.2
22.9
8.3
8.4
Sun Pharma
Buy
532
712
127,568
30,264
32,899
29.0
26.9
32.7
31.6
16.3
16.8
3.5
3.0
22.2
18.7
3.9
3.5
Power
Tata Power
Neutral
82
-
22,139
36,916
39,557
17.4
27.1
5.1
6.3
16.1
13.0
1.4
1.3
9.0
10.3
1.6
1.5
NTPC
Neutral
164
-
135,308
86,605
95,545
17.5
20.8
11.8
13.4
13.9
12.3
1.4
1.3
10.5
11.1
2.9
2.9
Power Grid
Neutral
223
-
116,691
25,315
29,193
88.2
88.7
14.2
17.2
15.8
13.0
2.4
2.1
15.2
16.1
9.3
8.3
Real Estate
Prestige Estate
Neutral
268
-
10,065
4,707
5,105
25.2
26.0
10.3
13.0
26.1
20.7
2.1
1.9
10.3
10.2
3.3
3.0
MLIFE
Buy
421
522
2,160
1,152
1,300
22.7
24.6
29.9
35.8
14.1
11.8
1.0
1.0
7.6
8.6
2.6
2.2
Telecom
Bharti Airtel
Neutral
418
-
167,011
105,086
114,808
34.5
34.7
12.2
16.4
34.3
25.5
2.3
2.2
6.8
8.4
2.5
2.2
Idea Cellular
Neutral
93
-
33,356
40,133
43,731
37.2
37.1
6.4
6.5
14.5
14.2
1.2
1.1
8.2
7.6
1.8
1.6
zOthers
Abbott India
Neutral
4,417
-
9,386
3,153
3,583
14.1
14.4
152.2
182.7
29.0
24.2
142.5
121.7
25.6
26.1
2.7
2.3
Asian Granito
Buy
416
480
1,252
1,066
1,169
11.6
12.5
13.0
16.0
32.0
26.1
3.1
2.8
9.5
10.7
1.5
1.3
Bajaj Electricals
Buy
328
395
3,329
4,801
5,351
5.7
6.2
10.4
13.7
31.5
24.0
3.9
3.5
12.4
14.5
0.7
0.6
Banco Products (India)
Neutral
232
-
1,659
1,353
1,471
12.3
12.4
14.5
16.3
16.0
14.2
22.1
19.9
14.5
14.6
1.2
125.4
Coffee Day Enterprises
Neutral
245
-
5,047
2,964
3,260
20.5
21.2
4.7
8.0
-
30.6
2.8
2.6
5.5
8.5
2.1
1.9
Ltd
Competent Automobiles Neutral
229
-
147
1,137
1,256
3.1
2.7
28.0
23.6
8.2
9.7
44.0
39.8
14.3
11.5
0.1
0.1
Stock Watch
August 01, 2017
Company Name
Reco
CMP
Target
Mkt Cap
Sales ( Čcr )
OPM(%)
EPS (Č)
PER(x)
P/BV(x)
RoE(%)
EV/Sales(x)
(Č)
Price ( Č)
( Č cr )
FY17E
FY18E
FY17E
FY18E
FY17E
FY18E
FY17E
FY18E
FY17E
FY18E
FY17E
FY18E
FY17E
FY18E
zOthers
Elecon Engineering
Neutral
63
-
710
1,482
1,660
13.7
14.5
3.9
5.8
16.2
10.9
3.8
3.5
7.8
10.9
0.8
0.7
Finolex Cables
Neutral
467
-
7,142
2,883
3,115
12.0
12.1
14.2
18.6
32.9
25.1
17.5
15.3
15.8
14.6
2.2
2.0
Garware Wall Ropes
Neutral
888
-
1,942
863
928
15.1
15.2
36.4
39.4
24.4
22.5
4.4
3.8
17.5
15.9
2.2
2.0
Goodyear India*
Neutral
895
-
2,063
1,598
1,704
10.4
10.2
49.4
52.6
18.1
17.0
83.6
73.3
18.2
17.0
1.0
139.4
Hitachi
Neutral
2,023
-
5,499
2,081
2,433
8.8
8.9
33.4
39.9
60.6
50.7
48.9
40.7
22.1
21.4
2.6
2.2
HSIL
Neutral
378
-
2,732
2,384
2,515
15.8
16.3
15.3
19.4
24.7
19.5
24.5
21.1
7.8
9.3
1.3
1.2
Interglobe Aviation
Neutral
1,291
-
46,684
21,122
26,005
14.5
27.6
110.7
132.1
11.7
9.8
69.8
49.8
168.5
201.1
2.2
1.7
Jyothy Laboratories
Neutral
372
-
6,750
1,440
2,052
11.5
13.0
8.5
10.0
43.7
37.2
10.6
9.8
18.6
19.3
5.0
3.5
Kirloskar Engines India
Neutral
399
-
5,773
2,554
2,800
9.9
10.0
10.5
12.1
38.0
33.0
15.9
15.0
10.7
11.7
1.9
1.7
Ltd
Linc Pen & Plastics
Neutral
264
-
390
382
420
9.3
9.5
13.5
15.7
19.6
16.8
3.4
2.9
17.1
17.3
1.1
1.0
M M Forgings
Neutral
607
-
733
546
608
20.4
20.7
41.3
48.7
14.7
12.5
83.1
73.6
16.6
17.0
1.2
1.1
Manpasand Bever.
Neutral
797
-
4,559
836
1,087
19.6
19.4
16.9
23.8
47.2
33.5
5.7
4.9
12.0
14.8
5.2
3.9
Mirza International
Neutral
155
-
1,859
963
1,069
17.2
18.0
6.1
7.5
25.2
20.6
3.9
3.3
15.0
15.7
2.1
1.9
MT Educare
Neutral
71
-
282
366
417
17.7
18.2
9.4
10.8
7.6
6.6
1.7
1.5
22.2
22.3
0.7
0.6
Narayana Hrudaya
Neutral
307
-
6,274
1,873
2,166
11.5
11.7
2.6
4.0
116.1
77.4
7.1
6.4
6.1
8.3
3.5
3.0
Navkar Corporation
Buy
204
265
2,906
347
371
43.2
37.3
6.7
6.0
30.6
34.0
2.1
1.9
6.2
10.6
9.5
8.9
Navneet Education
Neutral
165
-
3,842
1,062
1,147
24.0
24.0
6.1
6.6
27.0
24.8
5.6
4.9
20.6
19.8
3.7
3.4
Nilkamal
Neutral
1,873
-
2,795
1,995
2,165
10.7
10.4
69.8
80.6
26.8
23.2
107.1
93.0
16.6
16.5
1.4
1.2
Page Industries
Neutral
16,384
-
18,274
2,450
3,124
20.1
17.6
299.0
310.0
54.8
52.9
364.9
278.6
47.1
87.5
7.5
5.9
Parag Milk Foods
Neutral
247
-
2,078
1,919
2,231
9.3
9.6
9.5
12.9
26.2
19.1
4.1
3.4
15.5
17.5
1.2
1.1
Quick Heal
Neutral
213
-
1,495
408
495
27.3
27.0
7.7
8.8
27.5
24.2
2.6
2.6
9.3
10.6
2.8
2.3
Radico Khaitan
Neutral
142
-
1,883
1,667
1,824
13.0
13.2
6.7
8.2
21.3
17.3
1.9
1.8
9.0
10.2
1.5
1.4
Relaxo Footwears
Neutral
476
-
5,714
2,085
2,469
9.2
8.2
7.6
8.0
62.9
59.9
24.4
20.8
17.9
18.8
2.8
2.4
S H Kelkar & Co.
Neutral
265
-
3,827
1,036
1,160
15.1
15.0
6.1
7.2
43.3
36.9
4.6
4.3
10.7
11.5
3.6
3.1
Siyaram Silk Mills
Buy
2,090
2,500
1,959
1,574
1,769
12.5
12.7
97.1
113.1
21.5
18.5
3.3
2.9
15.4
15.5
1.4
1.3
Styrolution ABS India*
Neutral
1,082
-
1,903
1,440
1,537
9.2
9.0
40.6
42.6
26.7
25.4
68.1
61.9
12.3
11.6
1.3
1.2
Surya Roshni
Neutral
282
-
1,235
3,342
3,625
7.8
7.5
17.3
19.8
16.3
14.3
31.0
24.9
10.5
10.8
0.6
0.6
Team Lease Serv.
Neutral
1,381
-
2,360
3,229
4,001
1.5
1.8
22.8
32.8
60.6
42.0
6.5
5.6
10.7
13.4
0.6
0.5
The Byke Hospitality
Neutral
204
-
818
287
384
20.5
20.5
7.6
10.7
26.9
19.1
5.6
4.5
20.7
23.5
2.9
2.1
Stock Watch
August 01, 2017
Company Name
Reco
CMP
Target Mkt Cap
Sales ( Čcr )
OPM(%)
EPS (Č)
PER(x)
P/BV(x)
RoE(%)
EV/Sales(x)
(Č)
Price ( Č)
( Č cr )
FY17E FY18E FY17E FY18E FY17E FY18E FY17E FY18E FY17E FY18E FY17E FY18E FY17E FY18E
zOthers
Transport Corporation of
Neutral
315
-
2,413
2,671
2,911
8.5
8.8
13.9
15.7
22.7
20.1
3.1
2.8
13.7
13.8
1.0
0.9
India
TVS Srichakra
Neutral
3,606
-
2,761
2,304
2,614
13.7
13.8
231.1
266.6
15.6
13.5
405.2
319.1
33.9
29.3
1.2
1.0
UFO Moviez
Neutral
376
-
1,039
619
685
33.2
33.4
30.0
34.9
12.6
10.8
1.7
1.5
13.8
13.9
1.4
1.1
Visaka Industries
Neutral
474
-
752
1,051
1,138
10.3
10.4
21.0
23.1
22.5
20.5
60.7
56.8
9.0
9.2
1.0
0.9
VRL Logistics
Neutral
327
-
2,986
1,902
2,119
16.7
16.6
14.6
16.8
22.5
19.5
4.9
4.3
21.9
22.2
1.7
1.5
VIP Industries
Buy
172
218
2,434
1,270
1,450
10.4
10.4
5.6
6.5
30.8
26.5
6.4
5.6
20.7
21.1
1.9
1.7
Navin Fluorine
Neutral
700
-
3,447
789
945
21.1
22.4
24.0
28.7
29.1
24.4
4.7
4.0
17.8
18.5
4.3
3.5
Source: Company, Angel Research; Note: *December year end; #September year end; &October year end; Price as on July 31, 2017
Market Outlook
August 01, 2017
Research Team Tel: 022 - 39357800
DISCLAIMER
Angel Broking Private Limited (hereinafter referred to as “Angel”) is a registered Member of National Stock Exchange of India
Limited,Bombay Stock Exchange Limited and Metropolitan Stock Exchange Limited. It is also registered as a Depository Participant with
CDSL and Portfolio Manager with SEBI. It also has registration with AMFI as a Mutual Fund Distributor. Angel Broking Private Limited is a
registered entity with SEBI for Research Analyst in terms of SEBI (Research Analyst) Regulations, 2014 vide registration number
INH000000164. Angel or its associates has not been debarred/ suspended by SEBI or any other regulatory authority for accessing
/dealing in securities Market. Angel or its associates/analyst has not received any compensation / managed or
co-managed public offering of securities of the company covered by Analyst during the past twelve months.
This document is solely for the personal information of the recipient, and must not be singularly used as the basis of any investment
decision. Nothing in this document should be construed as investment or financial advice. Each recipient of this document should make
such investigations as they deem necessary to arrive at an independent evaluation of an investment in the securities of the companies
referred to in this document (including the merits and risks involved), and should consult their own advisors to determine the merits and
risks of such an investment.
Reports based on technical and derivative analysis center on studying charts of a stock's price movement, outstanding positions and
trading volume, as opposed to focusing on a company's fundamentals and, as such, may not match with a report on a company's
fundamentals. Investors are advised to refer the Fundamental and Technical Research Reports available on our website to evaluate the
contrary view, if any.
The information in this document has been printed on the basis of publicly available information, internal data and other reliable
sources believed to be true, but we do not represent that it is accurate or complete and it should not be relied on as such, as this
document is for general guidance only. Angel Broking Pvt. Limited or any of its affiliates/ group companies shall not be in any way
responsible for any loss or damage that may arise to any person from any inadvertent error in the information contained in this report.
Angel Broking Pvt. Limited has not independently verified all the information contained within this document. Accordingly, we cannot
testify, nor make any representation or warranty, express or implied, to the accuracy, contents or data contained within this document.
While Angel Broking Pvt. Limited endeavors to update on a reasonable basis the information discussed in this material, there may be
regulatory, compliance, or other reasons that prevent us from doing so.
This document is being supplied to you solely for your information, and its contents, information or data may not be reproduced,
redistributed or passed on, directly or indirectly.
Neither Angel Broking Pvt. Limited, nor its directors, employees or affiliates shall be liable for any loss or damage that may arise from
or in connection with the use of this information.